
Google Data Studio (GDS) is an incredibly popular visualization platform—mainly for two reasons: 1) it’s free and 2) it’s powerful, even when you’re just using the simple graphs and tables available straight out of the box. But if you’re willing to dig a bit deeper, there are more features you can leverage to create more compelling and informative content—even for some pretty complex use cases. In this post, I’ll cover one such example: parameter powered filters.
When Normal Filters Just Won’t Cut It
Google Data Studio already has filters, but in order to use them, the possible filter values must be pre-populated via a dimension specified in your data source. Though what happens when those dimensions are overloaded with many different values? For example, what if you’re like one of my clients, Humanity In Action (HIA), and you have a content-heavy site with tags on all your articles? And more specifically, what if you don’t have just one tag per article, but multiple tags, as you can see HIA does from this article about their work on COVID-19 in India.

If you’re using tags, you should also be using a custom dimension or content group in Google Analytics to keep track of which tags are getting the most views. But even when you do that, you’ve still got a problem if you have multiple tags per article. Because the single content group gets overloaded with multiple tag values. In the case above, those values are: Health, International Affairs, and Socioeconomics.
The overloaded field makes it complicated if you simply want to break out the data on a single tag (e.g. just ‘Health’). You could create one dimension for every one of your tag values as a workaround, but if you’ve got 40+ tags like Humanity In Action does, there are not enough custom fields available for each one. So what do you do instead?
Google Data Studio Parameters to the Rescue!
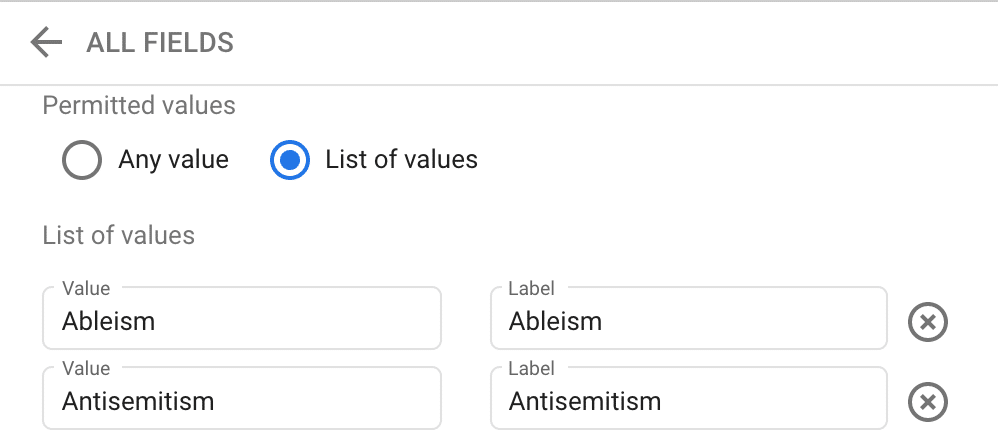
With GDS parameters, you can hack together a solution. The first step is to define a new parameter as part of your Google Analytics data source in GDS. I named mine Select Tag and specified “List of Values” for the Permitted Values option. Then I added enough entries in the table to cover all the different parameters in use by HIA.
Next, you create a new dimension that makes use of this new parameter. You input the following formula:

Step Three: Profit!
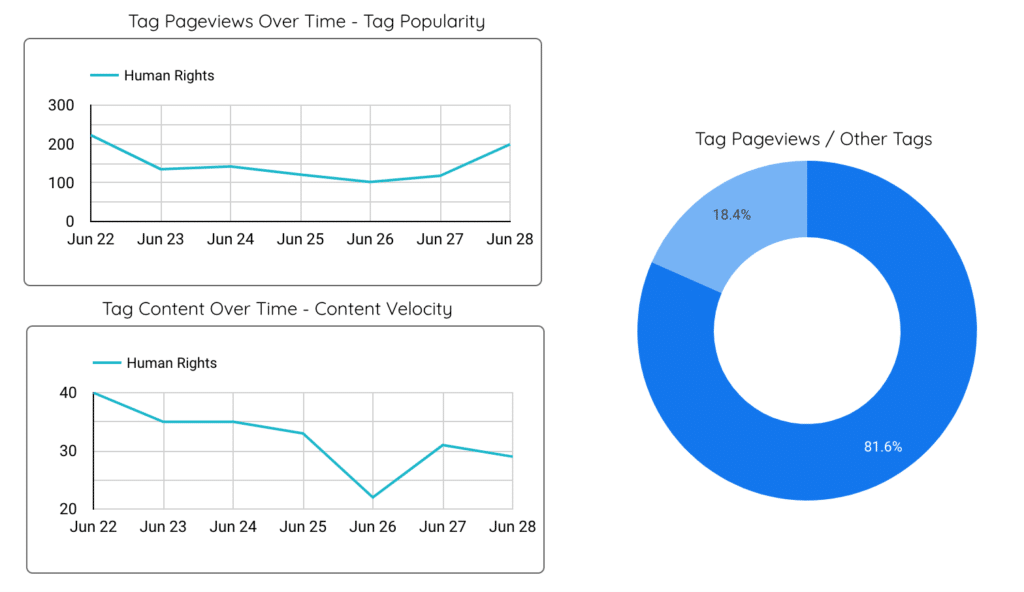
With these tweaks in place, you can start creating GDS components that make use of this new parameter-powered dynamic filter. There’s a screenshot of some of the components below, but I encourage you to play around with the live version of the dashboard. HIA graciously allowed their data to be made public, and it’s actually quite interesting to compare the popularity trends of all the different article tags. There’s tons of content on the site, which goes along with all the great work that the organization does around the world.
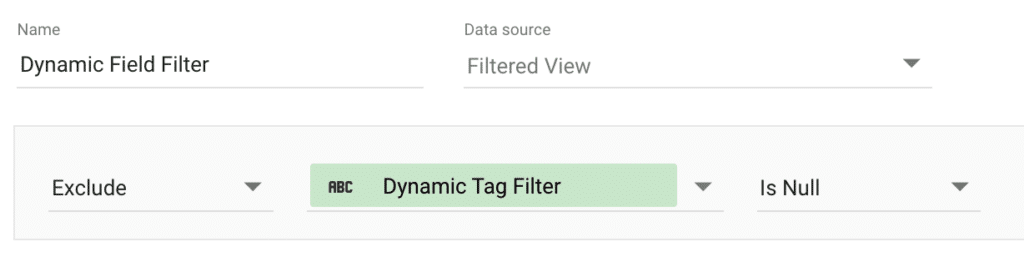
One last thing you’ll want to add to your components: a filter that works with the new dimension we created above to hide values that are not in use.
Conclusion
This article just scratched the surface of all that’s possible with Google Data Studio. Given how powerful the platform is, it should definitely be your first stop for data visualization before trying more expensive tools. There’s a good chance that you can squeeze what you need out of GDS, you just need a little know-how. And if you need help with other visualization or analytics tasks, don’t hesitate to reach out via my services page.