
Introduction
If you’ve used Google Optimize, you know it’s a great FREE tool to run A/B tests, particularly for those of us who aren’t ready to shell out (at minimum) $2.5k per year for a premium A/B testing SaaS vendor like VWO or Optimizely. I actually haven’t used or recommended those tools so far in my work, since I think Google Optimize covers a range of use cases quite well—particularly in e-commerce. I also like how Optimize integrates seamlessly with Google Analytics, the other free tool which almost every site uses to monitor/analyze their web and/or app traffic.
That said, whenever you run a test in Optimize, one issue their reports don’t help you much with is how long to run your test. The reports only say that you should keep your test running at least two weeks. And this is across the board, no matter who you are or what you’re testing. My gut tells me they put this because sites generally have weekly cycles of traffic. So if you get in at least two of those cycles, hopefully you’ll smooth out any unlucky irregularity that might occur in either week.
But even if you have a lot of traffic/conversions in each arm of your A/B test, Optimize may not declare a winner even after two weeks. Instead it will say, “Keep your Experiment Running. We don’t have enough confidence to call a leader.” Of course, this will probably leave you wondering, “Well, how long do I need to let this thing keep running before Optimize can confidently declare a leader? Is it even worthwhile?” That’s what we’re here to talk about. Though beware, there be maths ahead.
If these trends continue…
I think the reason Optimize doesn’t tell you tell you how much longer to run your test is because a number of assumptions are required to make a guess—and they don’t want those assumptions to end up being wrong. But for an A/B testing practitioner—or someone who wants to give business-minded stakeholders at least a ballpark idea of test length—I believe it’s worthwhile to make those assumptions explicit and consider their implications. Especially if those assumptions are reasonable ones to begin with.
For example, I don’t think it’s unreasonable to say, “All right, we have all of this data… If the trends we have observed so far in the data continue, how much more data would we need before a winner could be declared with confidence? Of course it’s possible that the conversion rates in each experimental arm could fluctuate from what has already been observed, but gaining a foothold on this question can tamp down on what otherwise feels like unbounded uncertainty.
Mathy math. R you ready?
The number of different knobs to turn to arrive at an answer is not super trivial. But using R as your scratchpad/napkin, it’s not too hard as long as you know what you’re doing. Part of it depends on what kind of A/B test you’re running—for example, whether you’re looking at a lift in conversion rates OR a general revenue test. In this post, I’ll focus on the practical application of a pricing test, evaluating the revenue impact of an A/B test that changes the price of a single product.
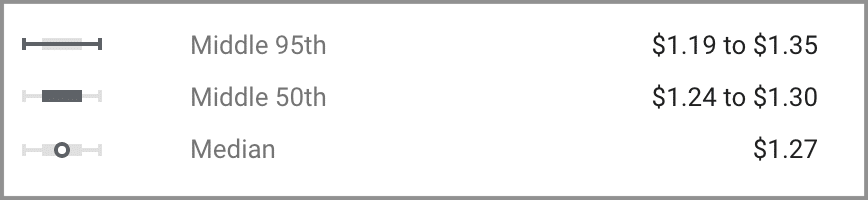
In this case, the relevant outcome variable is revenue per user. If you raise the price of a product, you are interested in whether the additional marginal income you make per sale is more than the revenue you lose from depressed demand (price effect vs quantity effect in econ nerd terms). In its reports, Optimize shows you the average revenue per user in each arm of the experiment, along with the credible intervals for each of those estimates. The task is to take what Optimize says and use it to figure out which economic effect—price or quantity—ultimately dominates.
How much variance you got in that variant?
Ideally, you would have access to user-level data to calculate the variance of the sample you’re dealing with. But you don’t get user-level data out of Optimize or Google Analytics by default (though maybe this is changing with GA4 due to its free integration with Big Query). In any case, you can still get a ballpark estimate of the sample variance by generating random normal variables in R and adjusting the standard deviation until you arrive at something that more or less matches the quantiles of the credible intervals displayed in Optimize’s report.
For this pricing test, you can actually do better in estimating the variance, since the underlying likelihood function is binomial. Revenue per user is normally distributed, but its randomness is determined by the decision a user faces whether or not to buy the product—which is binary. So in reality, you’re still dealing with a question of lift/fall in conversion rates. Beyond that, it is a matter of multiplying that random variable by the different product prices in each experimental arm.
In Bayesian stats, this situation is usually modeled using the beta distribution. Therefore, you can estimate the variance using the formula for the variance of a beta variable, inputting the data regarding the number of successes and failures, grab-able from the Optimize report.

R Code:
# P_a = price of product in experiment arm A
# P_b = price of product in experiment arm B
# S1 = successes in a
# F1 = failures in a; failures in either arm = total sessions - successes
# S2 = successes in b
# F2 = failures in b

var.a = (P_a**2) * ((S1 + 1)*(F1 + 1))/(((S1 + 1 + F1 + 1)**2)*(S1 + 1 + F1 + 1 + 1))
var.b = (P_b**2) * ((S2 + 1)*(F2 + 1))/(((S2 + 1 + F2 + 1)**2)*(S2 + 1 + F2 + 1 + 1))
Simulating more data
Now that you’ve estimated the variance, it’s time to scale up the experiment. Here’s where we must make our assumptions explicit—namely, that the trends observed so far in the data (i.e. the conversion rates in each arm) will continue. With that in mind, you can run the code that simulates more data/users being added to your experiment.
R Code:
N = floor((S1+S2+F1+F2)/2) #current sample size

P1 = S1/(S1+F1)
P2 = S2/(S2+F2)

m = 1 #this is the scaler; 2 to double your data, etc.
B = N*m
S1 = floor(B*P1)
F1 = B - S1
S2 = floor(B*P2)
F2 = B - S2

post.a = P_a*rbeta(B,shape1=S1+1,shape2=F1+1)
post.b = P_b*rbeta(B,shape1=S2+1,shape2=F2+1)
Once you’ve done this, you can estimate the posterior probability of B being better than A with the following line of code:
pos_prob = sum(post.b > post.a)/BWhile we arrived at the pos_prob here using random beta variables, the general approach still applies if you eyeball-estimate the variance using normal variables and the credible intervals from the Optimize report (as long as you’re not too short on data OR dealing with posteriors that don’t approximate to the normal curve). With your estimate of sigma, you can scale up your experiment. To sanity-check your work, check that when m = 1 in your simulation, the pos_prob roughly equals what it says in the “Probability to be Best” section of your Optimize report for the “B” variant.
Note that this only applies to a classic A/B test, not a generalized A/B/n test. Also be aware that if you don’t have a lot of conversions/data, the use of uninformative beta prior distributions (in post.a and post.b) might become problematic.
Getting some answers
Optimize declares a winner once the “Probability to be Best” of a variant exceeds 95%. If you play around with the value of m until pos_prob crosses that threshold, you’ll have an idea of how much more data you’ll need in order to cross that threshold. If that value turns out to be, for example, 1.5, it means you’d need all the data you already have, plus an additional 50%. If m = 2, you’d need twice as much, etc.
To get a sense of how many days that would take, check your GA reports to see how many new visitors your site is getting per day and use that to estimate how many days it will take to get m times the amount of data you already have. Though be mindful if your test isn’t running on 100% of traffic. If it looks like it will take a long time to reach m and you haven’t expanded the test to 100% of your traffic, you may want to consider doing that. Or maybe you’ll realize it’ll just take too long to get an answer, shut the thing down, and try something else.
Wait, isn’t that peeking?
A debate continues among both academic statisticians and other A/B testing junkies over whether Bayesian analysis of A/B tests suffers from “the peeking problem” that occurs in frequentist experimental analysis. Due to the way statistical significance is defined by traditional statisticians, it turns out that constantly checking the results of an A/B test—i.e. peeking—can increase the chance of a false positive result.
While Bayesian-flavored data scientists do concede that Bayesian methods are not immune to the peeking problem, I don’t think the type of hypothetical analysis I’m promoting here runs afoul of the issue. Unlike in the linked article—which focuses on the problems associated with using a loss function—I’m only working with the posterior probability, which is listed among the potential remedies at the end of the article.
One might also criticize the approach here by saying our analysis already assumes the result of the A/B test. Though I’d argue we’re not actually committing to that result; we’re simply getting a read on how much longer it would take us to be more confident about what we’re seeing at any given time. If conditions on the ground change, our estimate of the time remaining will change along with it.
Conclusion… and plug
If you’re an A/B testing practitioner with a working knowledge of R, hopefully this article gives you an approach to inform your A/B testing practice, and will help you inform the folks in your organization about how long they’ll need to keep their A/B tests in flight.
If all this felt quite tough/technical, though, don’t worry! A/B testing is an incredibly powerful tool to improve your online-oriented organization/business. So if you need help with this stuff, don’t hesitate to reach out. I specialize in the entire A/B testing pipeline—from strategy through implementation, monitoring, analysis, and follow-up. In many cases, I don’t even need support from your development team (and if you don’t have one, don’t worry). Just click here and tell me all about your A/B testing hopes and dreams ✨.