In my last post, I set up an A/B test through Google Optimize and learned Google Tag Manager (GTM), Google Analytics (GA) and Google Data Studio (GDS) along the way. When I was done, I wanted to learn how to integrate Enhanced E-commerce and Adwords into my mock-site, so I set that as my next little project.
As the name suggests, Enhanced E-commerce works best with an e-commerce site—which I don’t quite have. Fortunately, I was able to find a bunch of different mock e-commerce website source code repositories on Github which I could use to bootstrap my own. After some false starts, I found one that worked well for my purposes, based on this repository that made a mock e-commerce site using the “MEAN” stack (MongoDB, Express.js, AngularJS, and node.js).
Forking this repository gave me an opportunity to learn a bit more about modern front-end / back-end website building technologies, which was probably overdue. It was also a chance to brush up on my javascript skills. Tackling this new material would have been much more difficult without the use of WebStorm, the javascript IDE by the same makers of my favorite python IDE, PyCharm.
Properly implementing Enhanced E-commerce does require some back end development—specifically to render static values on a page that can then be passed to GTM (and ultimately to GA) via the dataLayer. In the source code I inherited, this was done through the nunjucks templating library, which was well suited to the task.
Once again, I used Selenium to simulate traffic to the site. I wanted to have semi-realistic traffic to test the GA pipes, so I modeled consumer preferences off of the beta distribution with $latex \alpha = 2.03 $ and $latex \beta = 4.67 $. That looks something like this:

The $latex x $ value of the beta distribution is normally constrained to the (0,1) interval, but I multiplied it by the number of items in my store to simulate preferences for my customers. So in the graph, the 6th item (according to an arbitrary indexing of the store items) is the most popular, while the 22nd and 23rd items are the least popular.
For the customer basket size, I drew from a poisson distribution with $latex \lambda = 3 $. That looks like this:

Although the two distributions do look quite similar, they are actually somewhat different. For one thing, the Poisson distribution is discrete while the beta distribution is continuous—though I do end up dropping all decimal figures when drawing samples from the beta distribution since the items are also discrete. However, the two distributions do serve different purposes in the simulation. The $latex x $ axis in the beta distribution represents an arbitrary item index, and in the poisson distribution, it represents the number of items in a customer’s basket.
So putting everything together, the simulation process goes like this: for every customer, we first draw from the Poisson distribution with $latex \lambda = 3$ to determine $latex q $, i.e. how many items that customer will purchase. Then we draw $latex q$ times from the beta distribution to see which items the customer will buy. Then, using Selenium, these items are added to the customer’s basket and the purchase is executed, while sending the Enhanced Ecommerce data to GA via GTM and the dataLayer.
When it came to implementing Adwords, my plan had been to bid on uber obscure keywords that would be super cheap to bid on (think “idle giraffe” or “bellicose baby”), but unfortunately Google requires that your ad links be live, properly hosted websites. Since my website is running on my localhost, Adwords wouldn’t let me create a campaign with my mock e-commerce website 🙁
As a workaround, I created a mock search engine results page that my users would navigate to before going to my mock e-commerce site’s homepage. 20% of users would click on my ‘Adwords ad’ for hoody sweatshirts on that page (that’s one of the things my store sells, BTW) . The ad link was encoded with the same UTM parameters that would be used in Google Adwords to make sure the ad click is attributed to the correct source, medium, and campaign in GA. After imposing a 40% bounce probability on these users, the remaining ones buy a hoody.
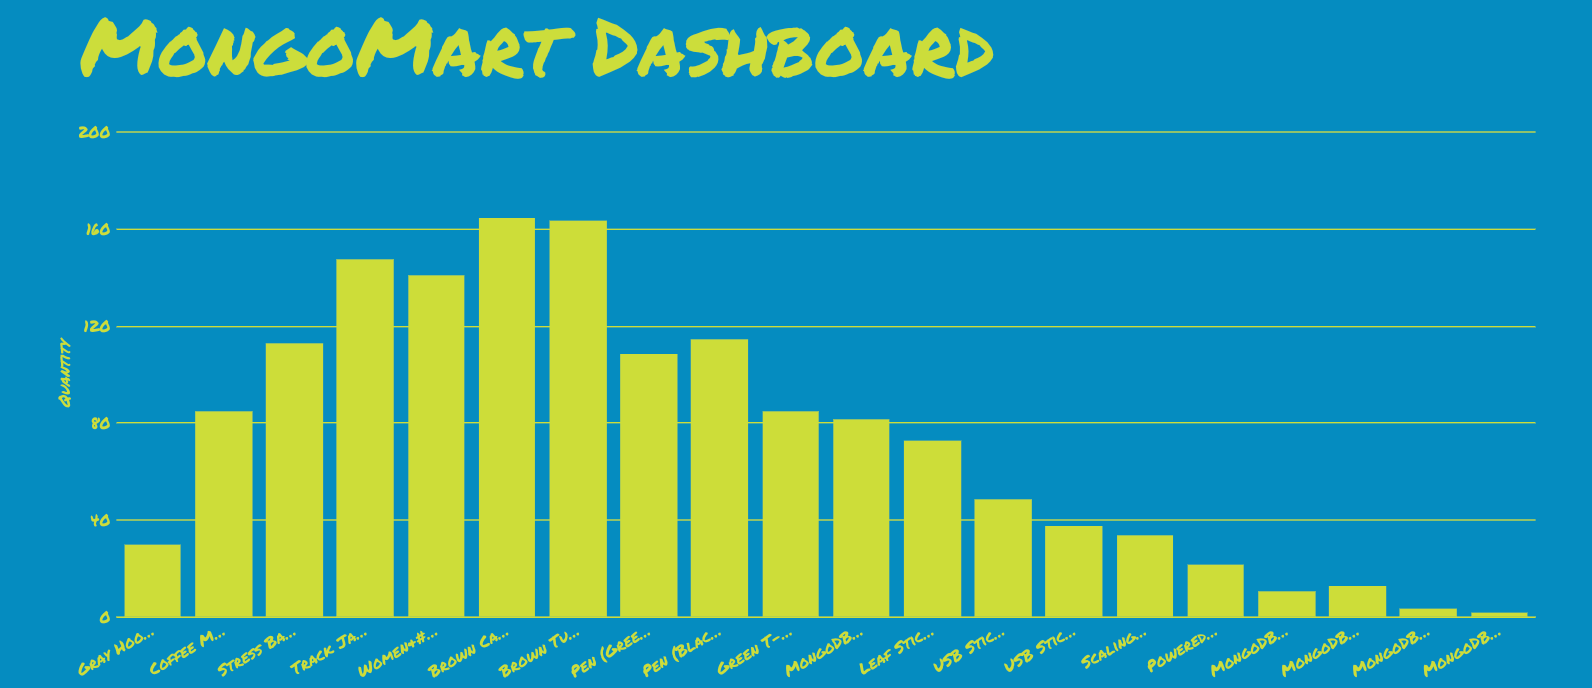
It seemed like I might as well use this project as another opportunity to work with GDS, so I went ahead and made another dashboard for my e-commerce website (live link):

If you notice that the big bar graph in the dashboard above looks a little like the beta distribution from before, that’s not an accident. Seeing the Hoody Promo Conv. Rate hover around 60% was another sign things were working as expected (implemented as a Goal in GA).
In my second go-around with GDS, however, I did come up against a few more frustrating limitations. One thing I really wanted to do was create a scorecard element that would tell you the name of the most popular item in the store, but GDS won’t let you do that.
I also wanted to make a histogram, but that is also not supported in GDS. Using my own log data, I did manage to generate the histogram I wanted—of the average order value.

I’m pretty sure we’re seeing evidence of the Central Limit Theorem kicking in here. The CLT says that the distribution of sample means—even when drawn from a distribution that is not normal—will tend towards normality as the sample size gets larger.
A few things have me wondering here, however. In this simulation, the sample size is itself a random variable which is never that big. The rule of thumb says that 30 counts as a large sample size, but if you look at the Poisson graph above you’ll see the sample size rarely goes above 8. I’m wondering whether this is mitigated by a large number of samples (i.e. simulated users); the histogram above is based on 50,000 simulated users. Also, because average order values can never be negative, we can only have at best a truncated normal distribution, so unfortunately we cannot graphically verify the symmetry typical of the normal distribution in this case.
But anyway, that’s just me trying to inject a bit of probability/stats into an otherwise implementation-heavy analytics project. Next I might try to re-implement the mock e-commerce site through something like Shopify or WordPress. We’ll see.